The world of Bitcoin is buzzing with fresh headlines as a critical indicator raises some eyebrows. The infamous “bearish cross” has appeared on Bitcoin charts, hinting that the crypto might be sliding further, but history suggests this could be more of a plot twist than a disaster. Buckle up as we dive into this rollercoaster!
Bitcoin’s Chart Drama: The Bearish Cross Takes Center Stage
On August 15, a tweet from the crypto world’s own Mags sent ripples through the trading community: “Bitcoin just printed a bearish cross on the daily chart.” Mags was referring to what’s known in the trading world as the “death cross,” a signal that often sends shivers down traders’ spines. This crossover happens when the 50-day simple moving average (SMA) of Bitcoin’s price dips below its 200-day SMA.
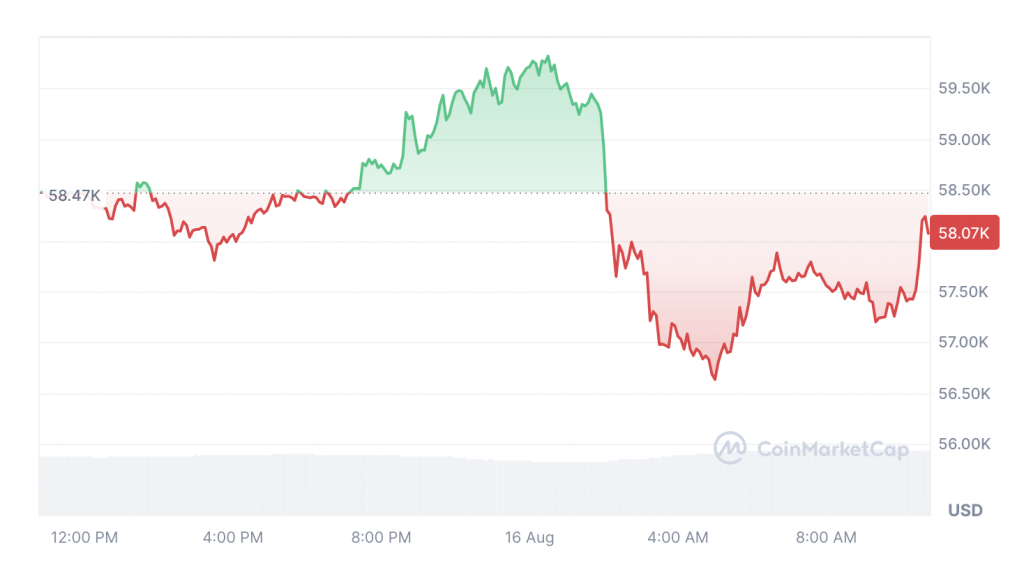
As of August 15, Bitcoin’s 50-day SMA was clocking in at $61,749, while its 200-day SMA was at $62,485, based on data from BuyBitcoinWorldwide. To put it simply, Bitcoin’s price was hanging below the $58,077 mark, according to CoinMarketCap, which had traders on edge.
What This Bearish Cross Really Means: Short-Term Wobbles or Long-Term Gains?
So, what’s the big deal? Mags explains that this bearish cross indicates “short-term weakness in the market.” Traders keep a close eye on these signals to gauge how Bitcoin’s recent performance stacks up against its long-term trends. According to IG market analyst Tony Sycamore, Bitcoin needs to reclaim its 200-day SMA, currently at $62,432, to stabilize and make a play for trend channel resistance near $70K.
Don’t Panic Yet: Could a Strong Reversal Be on the Horizon?
Before you hit the panic button, Mags offers a glimmer of hope. Historically, the appearance of a death cross has been followed by some impressive comebacks. For instance, in September 2023, Bitcoin’s 50-day SMA dipped below its 200-day SMA when Bitcoin was priced at $26,578. Fast forward four months, and the price had surged by 49% to $39,518.
Similarly, in July 2021, the 50-day SMA was $34,671, trailing behind the 200-day SMA at $44,680. Four months later, Bitcoin saw a 54% jump, reaching $54,813.
“The bullish confirmation will be a reclaim of the MA’s followed by a nice bullish cross,” Mags added, providing some optimism amidst the caution. However, Mags also warned that “if the pattern repeats, we might see a few weeks of choppy price action here.”
What’s Up with the $600 Million Bitcoin Transfer?
Adding another twist to the Bitcoin tale, Cointelegraph recently reported that the U.S. government has transferred nearly $600 million worth of Bitcoin to Coinbase. While this news might seem alarming, it’s unlikely to lead to immediate selling pressure. Ryan Lee, chief analyst at Bitget Research, clarified that this transfer doesn’t equate to the sale of 10,000 Bitcoins. Instead, it’s part of a collaboration between the U.S. Marshals Service and Coinbase Prime to manage and trade substantial digital assets.
The Takeaway: A Rocky Road Ahead?
In the crypto world, it’s always a wild ride. While the bearish cross may suggest some short-term turbulence for Bitcoin, historical data shows potential for a comeback. Keep your eyes peeled and your seatbelt fastened as Bitcoin navigates through these choppy waters.


